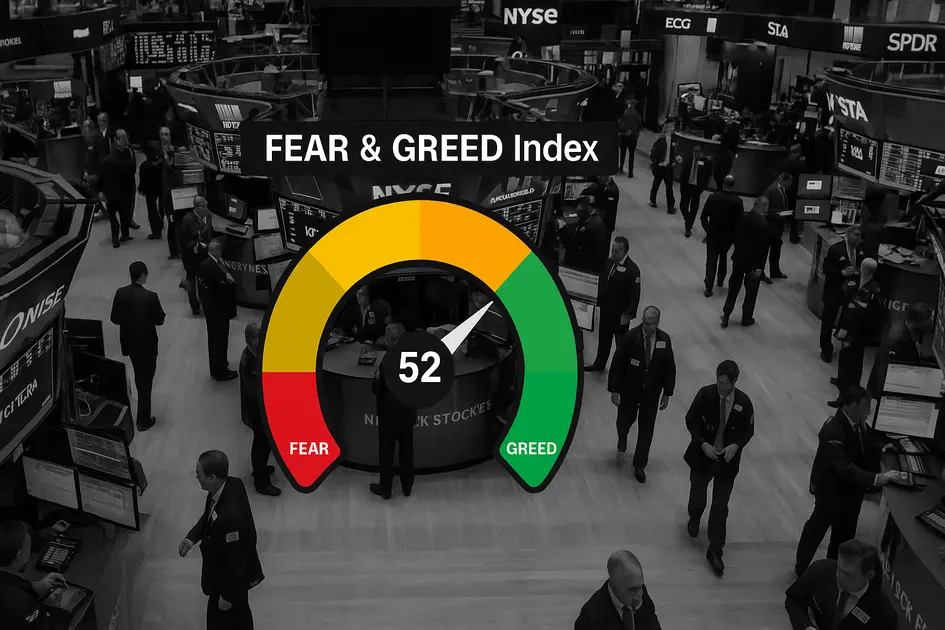
The CNN Fear & Greed Index is a composite market sentiment indicator designed to capture the prevailing emotion in the U.S. equity market by aggregating seven key measures of investor behavior. The index is heavily referenced by both retail and professional investors as a contrarian gauge: extreme fear often precedes market bottoms and strong buying opportunities, while extreme greed can warn of overbought conditions and heightened risk of correction.
Reviewing historical performance reveals that the index frequently aligns with pivotal market turning points, making it a valuable element in an investor’s toolkit, especially when combined with fundamental analysis, technical signals and informed risk management. However, investors must also recognize its limitations: there are instances when the index lags or sends false signals, particularly during unique macro shocks or when structural market changes are underway.
Index Methodology & Components
Theoretical Basis
Behavioral finance shows that herd mentality, loss aversion and recency bias heavily influence equity market cycles. The Fear & Greed Index translates collective investor emotion into a daily score ranging from 0 (extreme fear) to 100 (extreme greed). Excessive fear can result in sharp, sometimes irrational, selloffs while excessive greed may drive unsustainable rallies and asset bubbles.
How the Index Is Calculated
The index consists of seven equally weighted indicators:
Stock Price Momentum: S&P 500 vs. its 125-day moving average: captures trend strength and overbought/oversold positioning.
Stock Price Strength: Number of stocks hitting 52-week highs vs. lows on the NYSE: measures underlying leadership or breadth.
Stock Price Breadth: Volume in advancing vs. declining stocks: reflects the conviction behind market moves.
Put/Call Option Ratios: Gauges hedging or speculative behavior in options markets.
Junk Bond Demand: Spread between yields on junk and investment-grade bonds: shows risk appetite in credit markets.
Market Volatility (VIX): Volatility as measured by the VIX vs. its 50-day average: high volatility reflects fear, low volatility may signal complacency.
Safe Haven Demand: Differences in risk-adjusted returns between stocks and Treasuries: tracks flight to safety vs. risk-on positioning.
Each component is normalized (min-max scaled) to fit a 0-100 range; the composite index is the simple average. Zones are defined as follows:
Extreme Fear: 0–25
Fear: 26–45
Neutral: 46–55
Greed: 56–75
Extreme Greed: 76–100
Compared to other sentiment tools (like AAII or Investors Intelligence), the CNN index is more market-data-driven and updated daily, while surveys rely on weekly self-reported investor feelings.
Historical Performance Analysis
Market Turning Points
Historical data shows that extremes in the index have occurred near major reversals:
March 2020 (COVID crash): Index hit 2–3; S&P 500 rebounded ~68% over the next 12 months.
November 2021 (euphoria peak): Index above 90 (extreme greed); followed by a 20%+ S&P 500 decline over 2022–2023.
October 2022 (bear market bottom): Index at 20–25; preceded recovery and 15%+ gains into mid-2023.
Performance studies (2011–2024) show that the predictive power of the index was strongest before 2014, but still statistically significant for U.S. equities in recent years. The correlation is weaker in periods dominated by macro shocks or policy changes.
Index Limitations
Lagging and false signals: Occasionally, extreme fear readings precede further downside (e.g., early 2008).
Structural changes: Macro policy, algorithmic and passive flows can blunt index effectiveness.
Deep Dive: Seven Component Analysis
Stock Price Momentum: Momentum above the 125-DMA usually signals risk appetite; sharp underperformance (well below the average) has historically occurred near bottoms.
Example: In March 2020, S&P 500 was >20% below the 125-DMA, syncing with extreme fear.
Stock Price Strength: A surge in new 52-week lows flags broad capitulation; clusters at bottoms.
Example: October 2022 saw 52-week lows vastly outnumbering highs—opportunity for accumulation.
Stock Price Breadth: Negative volume breadth (decliners dominating advancers) confirms distress.
Put/Call Ratio: A spike in put volume often signals investors are overly defensively positioned—contrarian bullish.
Example: In March 2020, the put/call ratio reached its highest reading in years, preceding a rebound.
Junk Bond Demand: Widening spreads reflect aversion to risk; narrowing during rallies (greed).
Market Volatility (VIX): Elevated above long-term average signals panic, troughs indicate complacency.
Safe Haven Demand: Outperformance of Treasuries over stocks = fear; vice versa = greed.
Strategic Application: Investment Framework
Buying Framework (this is not investment advice)
Extreme Fear (0–25):
Strategy: Begin buying (25% exposure at 15–25, add 25% if zone persists 3+ days, deploy remainder with technical confirmation).
Why It Works: Capitulation and forced selling create attractive valuations; emotional exhaustion often sets meaningful lows.
History: S&P 500 has averaged double-digit gains 6–12 months out.
Caveat: Not all readings mark the final bottom; staged entries and diversification are key.
Fear Zone (26–45):
Strategy: Selectively buy high-quality names; require technical/fundamental confirmation.
Selling/Profit-Taking Framework (this is not investment advice)
Extreme Greed (76–100):
Strategy: Trim 20–40% of equity holdings at >85 index, raise cash, set tighter stops or use options to hedge.
Historical Pattern: Average 6–12 month drawdowns exceed 10–15%.
Caveat: Avoid selling all—continue to hold core winners.
Greed Zone (56–75):
Strategy: Tighten risk parameters, review for weak holdings, prepare exit or hedged strategies.
Integration & Position Sizing
Multi-timeframe: Overlay daily readings with weekly/monthly trends; strongest signals emerge when all align.
Portfolio Construction Recommendations:
Extreme Fear: 70–80% equity, overweight cyclicals, high-beta names
Neutral: 60–70% equity, diversified
Extreme Greed: 40–50% equity, overweight defensives and cash
Risk Controls: Never rely solely on sentiment; use as part of a broader discipline (include technical, fundamental and macro inputs).
Current Market Context (as of Oct 15, 2025)
Current Reading: The index stands at 32, placing it solidly in the "fear" zone. This comes after a year notable for periodic volatility but without any readings in extreme greed territory (above 90) and only sporadic dips into extreme fear (below 10).
Component Check: Most index components are reflecting caution rather than panic. Breadth and momentum are moderately negative, while volatility and put/call ratios indicate above-average hedging and risk aversion, but not at extremes. No component is showing signs of capitulation or excessive bullishness.
Implication: While not a strong contrarian buy or sell signal, a reading of 32 suggests broadly defensive positioning in the market. This environment favors disciplined, selective accumulation of high-quality assets—ideally using technical and fundamental confirmation—while avoiding aggressive risk-taking or significant portfolio rebalancing at this stage.
Actionable Strategy Guide (again, not investment advice)
Buy Triggers:
Begin accumulating below 25; increase at 15, max out at sub-10 (use staged approach).
Sell Triggers:
Take 20% profits >80, 40% >90, reduce to minimum exposure >95.
Position Sizing:
Extreme fear: up to 80% equity; neutral: 60–70%; extreme greed: 40–50%.
Confirmation: Always cross-check with technical signals (RSI, MACD), macro context (Fed policy), and market breadth.
Case Studies
March 2020 (COVID Panic):
Index: 2–3
Context: Pandemic uncertainty, market crash
Action: Buy signal according to strategy
Outcome: S&P 500 +68% over 12 months
Lesson: Contrarian buying, though stressful, is highly effective at peak fear.
November 2021 (All-Time High):
Index: >90
Context: Inflation worries underappreciated, market euphoric
Action: Reduce risk; trim holdings
Outcome: S&P 500 -20% in following year
Lesson: Greed zones reliably precede corrections, but selling everything isn’t necessary
December 2018 (Fed Hike Panic):
Index: ~4
Context: Aggressive Fed, volatility spike
Action: Begin buying
Outcome: Rapid 30% rally over 6 months
Lesson: Macro shocks amplify sentiment signals, favor staged re-entry.
October 2022 (Bear Market Lows):
Index: 20–25
Context: Fed tightening, inflation peak
Action: Accumulate quality equities
Outcome: +15% by mid-2023
Jan 2018 (Volatility Surge):
Index: >90
Context: Overextended market, VIX spike
Action: Trim risk
Outcome: 10%+ drop in weeks
Limitations & Warnings
The index can lag or trigger prematurely, especially in markets driven by macro news, algorithmic flows, or structural changes like ETF dominance.
Confirmation with other indicators (technical signals, macro, earnings seasons) is vital.
Contrarian investing is psychologically demanding; discipline is key to overcoming instinctual biases (“buying when terrified, selling when excited”).
Sector & Market Integration
Extreme Fear: Historically, cyclicals, financials, and discretionary stocks outperform from panic lows.
Extreme Greed: Defensive sectors, utilities, and staples fare better as risk premiums rise.
Tax, Trading, and Psychological Considerations
Favor tax-advantaged accounts for frequent rebalancing; minimize costs by using staged adjustments rather than daily trading.
Options (e.g., buying protective puts, writing calls) can complement reduction of risk at greed extremes.
Maintain written rules for action at specific index levels; this disciplines execution and tempers emotion.
Conclusion & Recommendations
The CNN Fear & Greed Index is a powerful tool for identifying market inflection points—but should always be used as a guide, not a crystal ball. Strict risk management, confirmation from multiple sources, and psychological readiness for contrarian action empower long-term outperformance. Integrate the index with fundamental trends, macro signals, and portfolio goals for a disciplined, rules-based approach to market cycles.
This analysis is provided for informational purposes only and does not constitute financial advice. Please conduct your own due diligence and consult with a qualified financial advisor before making investment decisions. Investing involves risk, including the potential loss of principal.